
Imagine this: you wake up, check your phone, and it says there’s a 40% chance of rain. You still leave without an umbrella… and of course, it rains. 🌧️ Congratulations — you’ve just experienced probability in real life!
🔢 What Is Probability?
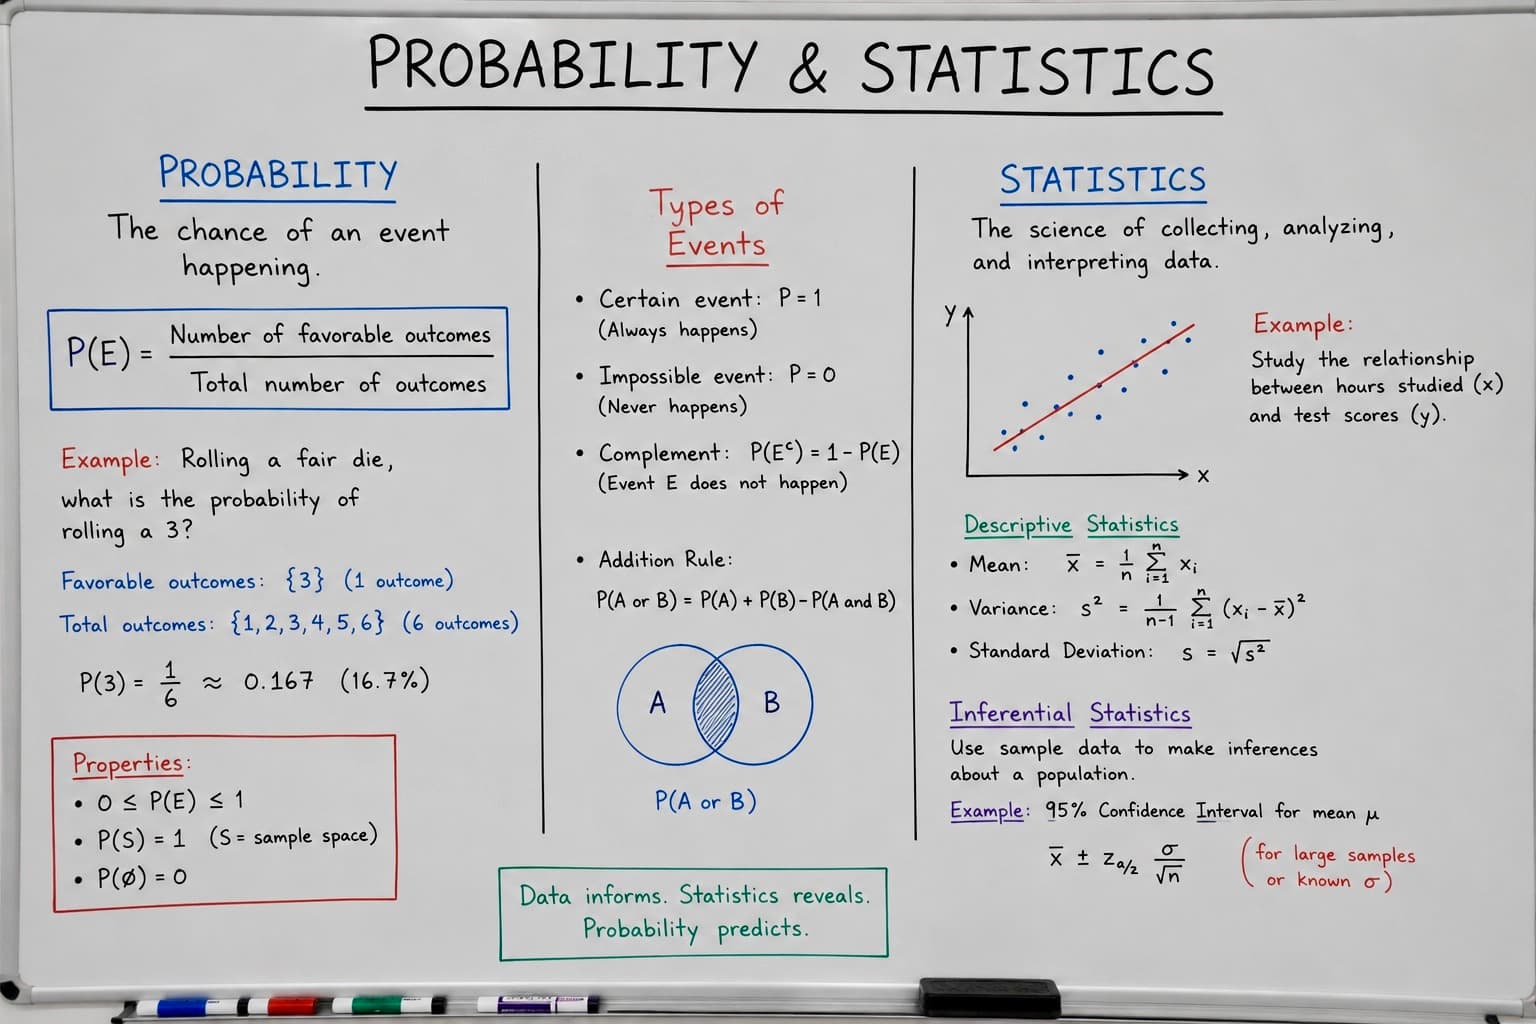
Probability is all about how likely something is to happen. We use it every day — we just don’t notice!
The chance your favorite team wins a match ⚽
The chance you’ll get an A in your next exam 📚
The chance your crush replies to your message 😅
We express it as a number between 0 and 1:
0 means “impossible” (like finding Wi-Fi in the desert 🏜️).
1 means “certain” (like your mom calling right when you start eating 🍛).
Example: If you flip a fair coin 🎯:
Probability of Heads = 0.5
Probability of Tails = 0.5
So, each side has the same chance — 50%. Easy, right?
📊 What About Statistics?
Now, statistics is what we do after collecting data. It helps us make sense of numbers, trends, and patterns.
Think of it like this: If probability is predicting what might happen, then statistics is analyzing what already happened.
😎 Real-Life Example
Let’s say you and your friends want to open a bubble tea shop 🍹. Before deciding the menu, you survey 100 people:
60 love strawberry flavor 🍓
30 like mango 🥭
10 prefer classic milk tea 🧋
You’ve just done data collection and used statistics to find out what’s popular. If you then use probability to guess which drink a new customer will choose — congratulations, you’re doing data science! 🤓
🤯 Fun Fact
Even your favorite apps use probability and statistics:
Spotify recommends songs using statistical patterns in your music taste 🎵
Netflix predicts what you’ll watch next 🍿
TikTok decides which video to show you next based on probability of you liking it 💃
So, every “For You Page” moment is powered by math (yep, no escape 😏).

